This article is a simple guide on how to trade the M pattern in forex. There are a number of patterns that traders use to identify potential trade reversals and opportunities and one of the preferred pattern formations is the M pattern.
The M pattern formation falls under the category of technical analysis and usually guides traders in spotting change in the direction of price movement.
The M pattern forms when the market is in an uptrend
Key Points to note about how to trade the M pattern.
1. The M pattern looks like the letter M on the price chart and forms highs that are almost at the same level.
2. A proper M pattern signals that the market is starting a bearish reversal or a downtrend and an uptrend might be coming to an end
3.The M pattern can be formed in any timeframe.
4.The M pattern confirms a change of trend only when price breaks and closes below the neckline of the previous low that was created hence indicating a potential downtrend. This breakout indicates that selling pressure is stronger than the buying pressure hence signaling a potential reversal from an uptrend to a downtrend. A strong confirmation comes when the price breaks below the neckline with increased trading volume. This reinforces the pattern’s reliability.
5. Not every M pattern results in a successful trade therefore it’s important for a trader to practice patience and wait for a proper breakout before entering a trade. This is mainly to avoid trading false breakouts that may lead to huge losses.
Read also: Tips to consider when choosing a broker
Uses of the M pattern
1.The M pattern helps identify change of trend.
When the market is in an uptrend then the momentum of candlesticks gets weaker as price is approaching the previous high and starts dropping then forms an M pattern, this communicates that the market is trying to change trend from continuing upwards to moving downwards because of the weak momentum as it fails to break the previous high. As price is moving towards the major levels, the market usually communicates whether there will be a change in trend depending on how price approaches the major levels.
2.The M pattern helps a trader to identify their area of interest.
When price is approaching the previous high with a weak momentum, this communicates that a trader should be looking for any confirmation candlesticks or patterns so that they can take their sell entries. Ensure to only enter sell positions once the price breaks and closes below the neckline. A trader can also prefer to wait for a retest of the neckline after the breakout as a safer entry point.
3.M formations also help guide a trader to determine their targets (identify their entry and exit points.)
As price is approaching the previous high with a weak momentum, this should guide the trader to be looking out for sell entries since it signals that buyers are getting weaker and closing their positions.
Formation of the M pattern.
The M pattern forms when price creates two highs that are equal or almost at the same level hence creating double tops. When price fails to break the previous higher high and rather form double tops with a weak momentum then breaks and closes below the neckline which was the previous higher low, this typically signals a bearish reversal and buyers will be aiming at closing their positions as sellers look out for entry levels since the downtrend might be beginning.

When the market is in an uptrend and price keeps making higher highs (HH) and higher lows (HL) then makes a high that does not break the previous high but rather makes an equal high and starts moving down , it will have created an M pattern which is also known as a double top.
The types of M patterns.
As we learn how to trade the M pattern, it’s important to understand that there are different types of M formations in the market and below are the different types of M formations.
When the market is in an uptrend and makes double tops. This is when the market doesn’t break the previous high but rather makes equal highs and then starts a downward movement.
When the market is in an uptrend and makes a high and fails to meet the previous high but rather creates a lower high and starts making downward movement.

When the market makes a high, then a higher high and then breaks the previous high and breaks the neckline(HL) downwards

How to trade the M pattern
In an uptrend, the market is making higher highs and higher lows, when the price retests the last higher low but fails to break the previous higher high then moves back down and breaks the higher low creating a perfect M pattern then comes back to retest the broken neckline.
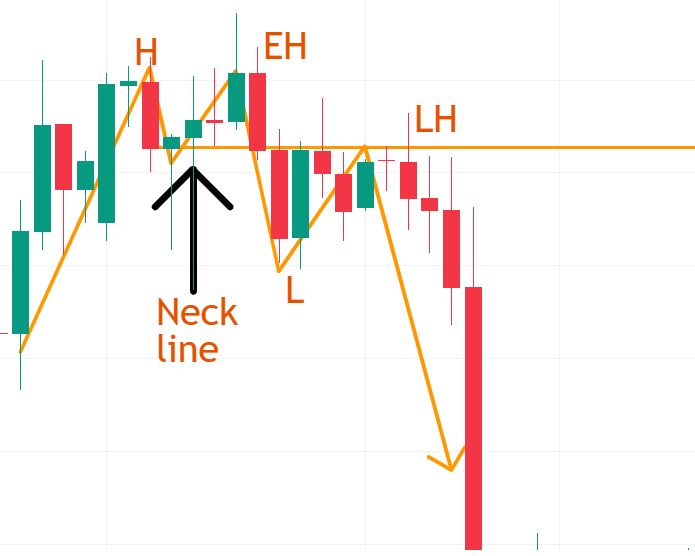
The moment price fails to break the previous high as seen in the above illustration, and makes an equal high with a weak momentum and price starts moving downwards creating an M pattern after breaking a neckline
Always make sure that price breaks the neckline of the previous higher low because it can easily continue upwards. After price breaking the neckline, there must be a retest of the the broken neckline and a trader needs to lookout for the formation of a lower low, equal low or a lower high to confirm a proper downtrend.
As you follow this guide on how to trade the M pattern, always remember that the M patterns in different timeframes have a different purposes. The M pattern formed in a bigger timeframe gives you the area of interest where you can easily identify your change of trend and the M pattern in a smaller timeframe will give you the area where you will take your entries.
By following these steps on how to trade the M pattern and maintaining disciplined risk management, you can effectively trade the M pattern and capitalize on potential trend reversals.
Want to start paper trading or live trading? Check out the following brokers
2.Deriv
3.Avatrade